The glacial till and underlying limestone bedrock across the Swords area create a setting where rippability and depth-to-rock can shift dramatically within a single site. When a contractor hit unexpected boulders during a deep drainage installation near the Ward River valley last year, the root issue was not the ground itself but the absence of a continuous velocity model that could have flagged the transition from stiff clay to limestone pinnacles. Seismic tomography bridges that gap: we generate P-wave and S-wave sections that tie directly to excavatability and stiffness parameters, cutting through the ambiguity that standard borehole logs leave behind. For sites where groundwater complicates the picture, combining the seismic refraction profile with a targeted resistivity survey often reveals perched water tables or solution features that would otherwise go unnoticed until excavation begins.
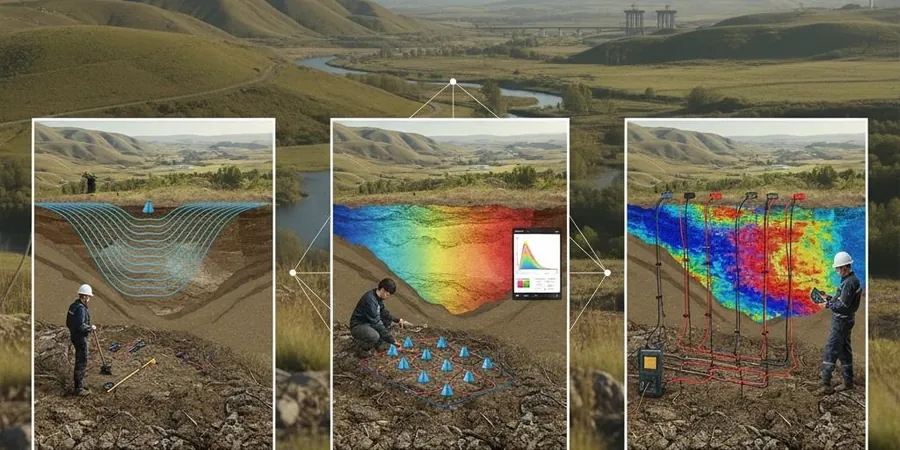
A velocity cross-section is not just an image — it is a continuous stiffness model that lets you anticipate hard digging, estimate rippability, and classify site response before a single borehole is logged.
Local considerations
The biggest source of error in a shallow seismic survey is not the equipment — it is the coupling. In Swords, where winter fieldwork often takes place on saturated grass or thin made ground over till, a poorly planted geophone can introduce a static shift that mimics a low-velocity layer. We mitigate that by checking every trace for polarity and amplitude consistency before stacking, and by running reciprocal shots at both ends of the spread. On a recent commercial development off the R132, the raw data showed what looked like a buried channel feature; after regrading the line and repeating the shot points, the anomaly disappeared — it was a coupling artefact caused by loose fill along an old field boundary. That kind of field judgement only comes from running refraction lines across the same glacial terrain season after season.
Frequently asked questions
What is the difference between seismic refraction and reflection for shallow site work?
Refraction uses first-arrival travel times and works best when velocity increases with depth, which suits the till-over-limestone setting typical of Swords. It gives you a 2D velocity model down to about 30–40 metres. Reflection processes later-arrival energy and can image deeper or low-velocity layers that refraction misses, but it requires more dense source and receiver spacing. In practice we often run both on the same line: refraction for the overburden-bedrock boundary, and reflection to check for deeper karst features or fractured zones within the limestone.
How long does a seismic tomography survey take on a typical Swords site?
For a single 120-metre refraction line with 24 channels, you are looking at about four to six hours of field time including setting out, planting geophones, shooting both ends, and packing up. If we add a MASW spread or run a second orthogonal line, the fieldwork stretches to a full day. Processing and interpretation usually take another three to five working days before the draft report lands on your desk.
What does a seismic tomography survey cost for a standard commercial site?
For a single-line refraction tomography survey with MASW on a typical Swords site — say a 120-metre spread with 24 geophones — the price runs between €2,420 and €5,220 depending on access conditions, the number of shot points, and whether reflection processing is added. A two-line grid or a cross-hole survey will push toward the upper end of that range. Every quote includes the raw field files, the processed velocity cross-section, and a signed report with Vs30 classification where required.